- Trading
- Trading
- Markets
- Markets
- Products
- Forex
- Commodities
- Metals
- Indices
- Shares
- Cryptocurrencies
- Treasuries
- ETFs
- Accounts
- Accounts
- Compare our accounts
- Our spreads
- Funding & withdrawals
- Open account
- Try free demo
- Platforms & tools
- Platforms & tools
- Platforms
- Platforms
- Platforms overview
- TradingView
- MetaTrader 4
- MetaTrader 5
- Mobile trading platforms
- Premium trading tools
- Premium trading tools
- Tools overview
- VPS
- Genesis
- Education
- Education
- Resources
- Resources
- News & analysis
- Education hub
- Economic calendar
- Earnings announcements
- Help & support
- Help & support
- About
- About
- About GO Markets.
- Our awards
- Sponsorships
- Client support
- Client support
- Contact us
- FAQs
- Quick support
- Holiday trading hours
- Maintenance schedule
- Fraud and scam awareness
- Legal documents
- Trading
- Trading
- Markets
- Markets
- Products
- Forex
- Commodities
- Metals
- Indices
- Shares
- Cryptocurrencies
- Treasuries
- ETFs
- Accounts
- Accounts
- Compare our accounts
- Our spreads
- Funding & withdrawals
- Open account
- Try free demo
- Platforms & tools
- Platforms & tools
- Platforms
- Platforms
- Platforms overview
- TradingView
- MetaTrader 4
- MetaTrader 5
- Mobile trading platforms
- Premium trading tools
- Premium trading tools
- Tools overview
- VPS
- Genesis
- Education
- Education
- Resources
- Resources
- News & analysis
- Education hub
- Economic calendar
- Earnings announcements
- Help & support
- Help & support
- About
- About
- About GO Markets.
- Our awards
- Sponsorships
- Client support
- Client support
- Contact us
- FAQs
- Quick support
- Holiday trading hours
- Maintenance schedule
- Fraud and scam awareness
- Legal documents
- Home
- News & Analysis
- Forex
- Is the EUR ready for its next leg down?
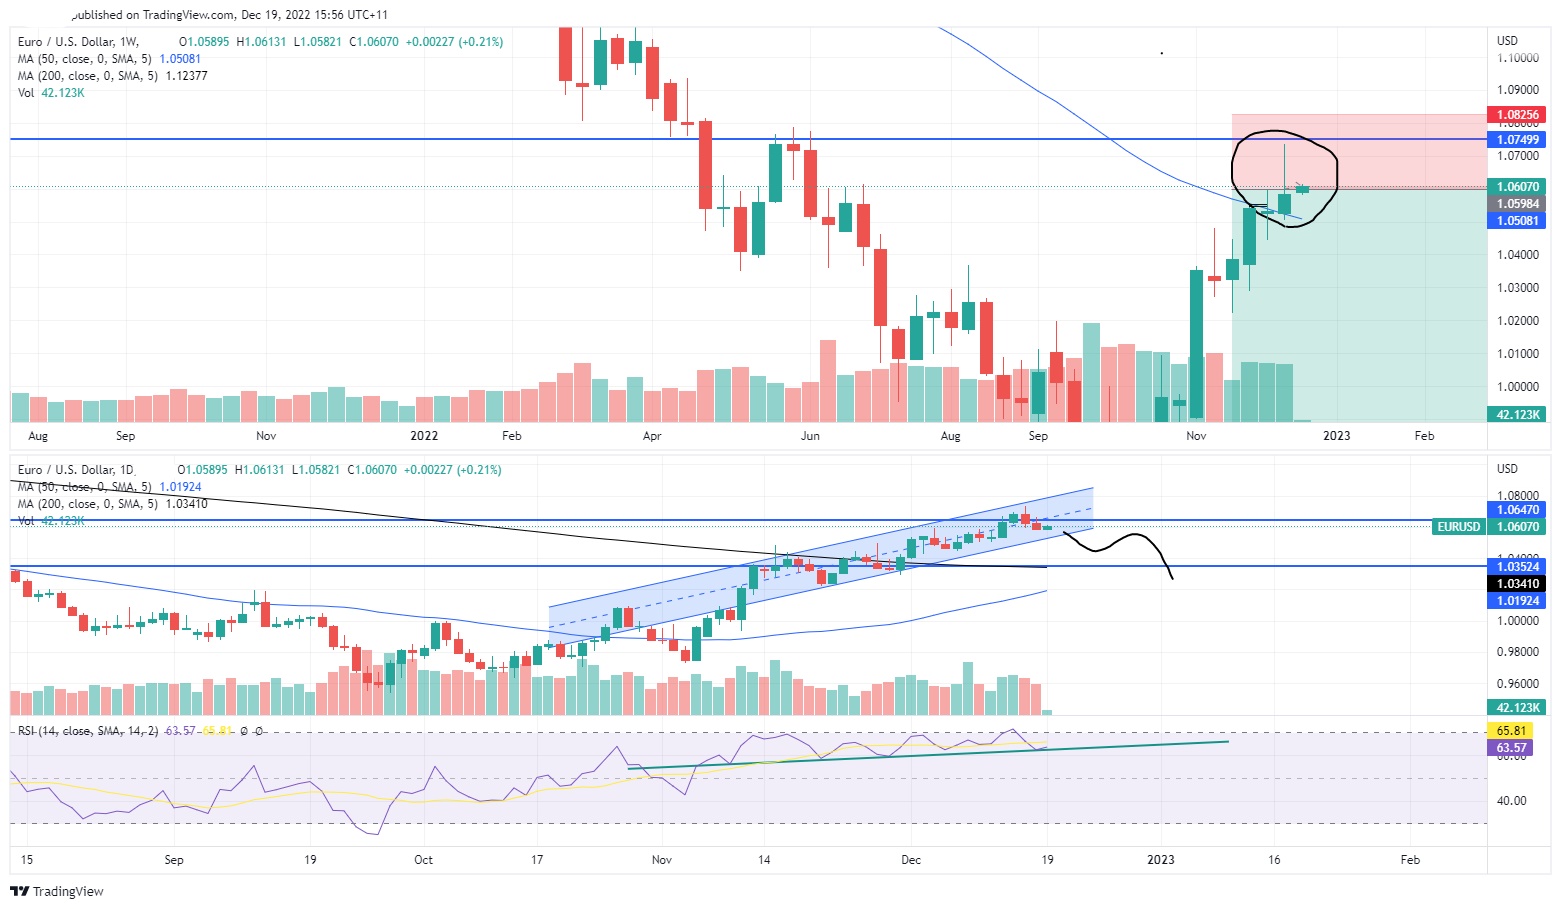
News & AnalysisThe EUR look to be turning after an impressive run. The pair has risen by 12.57%since it hit the bottom in September. At the time the price fell to 0.9525. This was the lowest level the EUR had reached since the year 2000. In September, Europe was facing extreme inflationary pressure and conversely the USD was rocketing towards record high levels. However, since this time the price recovered and now near the 50-week moving average.
After this great rebound it does seem as if the price is overextended and in need of a rest. As it can be seen on the weekly chart the candlesticks are showing an exhausted reverse hammer candlestick. It is categorised by a long wick and small body that has closed very near its open price. The price is also struggling to break above the resistance level at 1.07 which doubles as the 50-week moving average. The failure to break above would likely confirm that the price is still very much trending down. This also opens a potential trading opportunity to go short. With the price at resistance and potentially good risk reward till the next support all that is needed is a trigger for an entry.
Looking at the daily chart for some ideas for an entry is useful. Here the price is currently in an upward channel. If this channel were to breakdown, then it may indicate a breakdown of the price and an entry for the longer-term short trade. In addition, the RSI is still holding an upward trending pattern. Although it may also offer some confirmation of a break down. The RSI is relatively overbought and if it breaks down from the trend may signal a reversal.

With the Christmas holidays almost here, the volatility and liquidity may be a little lower but moving into 2023 may provide some good conditions for this trade to eventuate.
Ready to start trading?
Disclaimer: Articles are from GO Markets analysts and contributors and are based on their independent analysis or personal experiences. Views, opinions or trading styles expressed are their own, and should not be taken as either representative of or shared by GO Markets. Advice, if any, is of a ‘general’ nature and not based on your personal objectives, financial situation or needs. Consider how appropriate the advice, if any, is to your objectives, financial situation and needs, before acting on the advice.
Next Article
USDJPY tanks as Bank of Japan adjusts its threshold for intervention
The USDJPY has dropped more than 400 pips in just a few minutes after the Bank of Japan brought adjusted its intervention criteria. The bank did not change its official rate, which are -0.10%, an extremely low figure compared to almost every other country. Japan has been a show of dovishness in a sea of hawkishness. However, this latest move has be...
December 20, 2022Read More >Previous Article
US Dollar Index
The US Dollar Index plummeted on Tuesday, December 13, breaking below a major support following a softer-than-expected inflation report for November. ...
December 19, 2022Read More >Please share your location to continue.
Check our help guide for more info.


