- Trading
- Trading
- Markets
- Markets
- Products
- Forex
- Commodities
- Metals
- Indices
- Shares
- Cryptocurrencies
- Treasuries
- ETFs
- Accounts
- Accounts
- Compare our accounts
- Our spreads
- Funding & withdrawals
- Open account
- Try free demo
- Platforms & tools
- Platforms & tools
- Platforms
- Platforms
- Platforms overview
- TradingView
- MetaTrader 4
- MetaTrader 5
- Mobile trading platforms
- Premium trading tools
- Premium trading tools
- Tools overview
- VPS
- Genesis
- Education
- Education
- Resources
- Resources
- News & analysis
- Education hub
- Economic calendar
- Earnings announcements
- Help & support
- Help & support
- About
- About
- About GO Markets.
- Our awards
- Sponsorships
- Client support
- Client support
- Contact us
- FAQs
- Quick support
- Holiday trading hours
- Maintenance schedule
- Fraud and scam awareness
- Legal documents
- Trading
- Trading
- Markets
- Markets
- Products
- Forex
- Commodities
- Metals
- Indices
- Shares
- Cryptocurrencies
- Treasuries
- ETFs
- Accounts
- Accounts
- Compare our accounts
- Our spreads
- Funding & withdrawals
- Open account
- Try free demo
- Platforms & tools
- Platforms & tools
- Platforms
- Platforms
- Platforms overview
- TradingView
- MetaTrader 4
- MetaTrader 5
- Mobile trading platforms
- Premium trading tools
- Premium trading tools
- Tools overview
- VPS
- Genesis
- Education
- Education
- Resources
- Resources
- News & analysis
- Education hub
- Economic calendar
- Earnings announcements
- Help & support
- Help & support
- About
- About
- About GO Markets.
- Our awards
- Sponsorships
- Client support
- Client support
- Contact us
- FAQs
- Quick support
- Holiday trading hours
- Maintenance schedule
- Fraud and scam awareness
- Legal documents
- Home
- News & Analysis
- Articles
- Oil, Metals, Soft Commodities
- Market Analysis 27-31 March 2023
- Home
- News & Analysis
- Articles
- Oil, Metals, Soft Commodities
- Market Analysis 27-31 March 2023
 News & AnalysisNews & Analysis
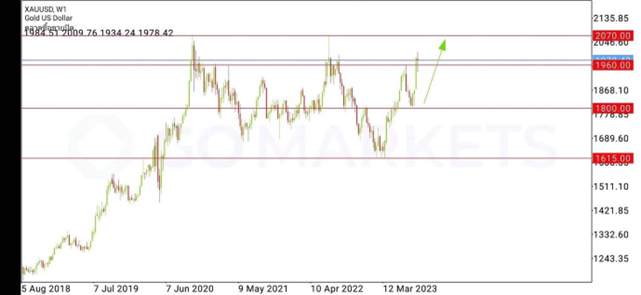
XAUUSD Analysis 27 – 31 March 2023
The gold price trend can be viewed both positively and negatively in the short and medium term. As the close of last week’s Doji bar indicates hesitation in the market. Although the previous three weeks, gold has had strong and consistent buying momentum since the beginning of March.
But even so, the gold price has not yet clearly shown strong selling momentum. Also, last week’s close of the Doji bar was a candle close above the 1960 support, the latest high of gold prices on the Weekly timeframe. The bull rose to test the resistance 2070, which is an important resistance at the weekly timeframe level or the price line that gold has ever done the most in history.
and in the event that gold prices cannot continue to rise A retracement to support at the time frame level of 1880 is the next target to watch. But regardless of whether the price will rise or fall Short-term forecasts on the time frame day can be seen as the possibility of a sideways or consolidation between the 1960 support and the 2000 resistance until the price direction is clear.

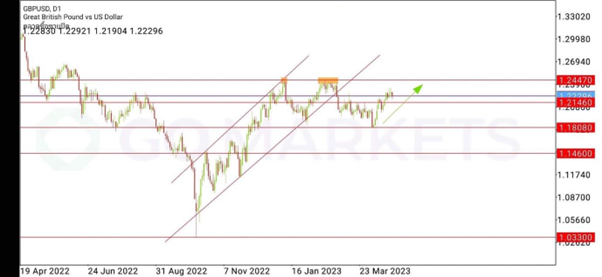
GBPUSD Analysis 27 – 31 March 2023
The GBPUSD outlook is bullish in the short and medium term, as the pair is currently moving sideways on the daily time frame and H4 (support 1.19140 and resistance 1.21460) rises above them. 1.21460 plus continued buying momentum based on the weekly nighttime buy candlestick, although last week’s closing price has retraced. Still, the price has yet to show a strong sell candle on the Weekly timeframe, indicating a clear uptrend in both the short and medium term.
forecasting that price There is a tendency for the price to rise to test the resistance of 1.24470, which is a key resistance at the time frame, which in the past the price has previously tested and formed a Double Top pattern, with the key support being 1.21460, a key support at the Tai level. Timeframe predicts that the price may be shortened or sideways. Corrected to rebound to test the resistance of 1.24470, which is the price target of GBPUSD.

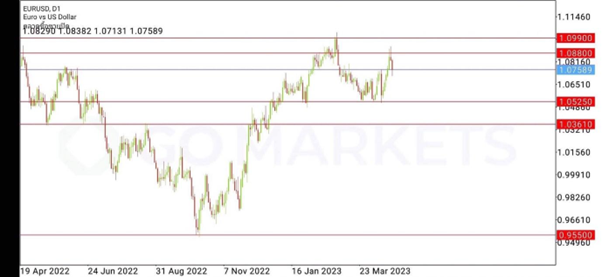
EURUSD Analysis 27 – 31 March 2023
The EURUSD started to lose its buying momentum significantly as the weekly timeframe was bullish as much as half of the candlestick. (Significantly) as last week’s closing price was lower than last week’s high. After rallying to test the 1.08800 time frame resistance and then breaking up to the 1.09300 level, which was the strongest upside of the week. Before there is a continuous sell down
forecasting that price There may be both upward and downward directions in the medium term, such as the time frame day. Due to the loss of buying momentum last week, the trend or trend of the price becomes less clear. The important price line to watch in the day frame is support 1.05250 (latest low) and resistance 1.08800 (latest high).
Ready to start trading?
Disclaimer: Articles are from GO Markets analysts and contributors and are based on their independent analysis or personal experiences. Views, opinions or trading styles expressed are their own, and should not be taken as either representative of or shared by GO Markets. Advice, if any, is of a ‘general’ nature and not based on your personal objectives, financial situation or needs. Consider how appropriate the advice, if any, is to your objectives, financial situation and needs, before acting on the advice.
Next Article
The DXY post-FOMC Decision
On Thursday last week, the US Federal Reserve met general market expectations by hiking rates by 25bps, taking interest rates in the US to 5.00%. While there was some speculation over a possible slowdown in the rate hikes due to the banking crisis, the decision by the Federal Open Market Committee (FOMC) to hike rates for the ninth consecutive time...
March 27, 2023Read More >Previous Article
Bollinger Bands – what are they and how can you use them in FX day trading
Bollinger Bands are one of the most popular indicators that FX and CFD traders use, invented in the 1980’s they are a technical analysis tool that a...
March 24, 2023Read More >Please share your location to continue.
Check our help guide for more info.

