- Trading
- Trading
- Markets
- Markets
- Products
- Forex
- Commodities
- Metals
- Indices
- Shares
- Cryptocurrencies
- Treasuries
- ETFs
- Accounts
- Accounts
- Compare our accounts
- Our spreads
- Funding & withdrawals
- Open account
- Try free demo
- Platforms & tools
- Platforms & tools
- Platforms
- Platforms
- Platforms overview
- TradingView
- MetaTrader 4
- MetaTrader 5
- Mobile trading platforms
- Premium trading tools
- Premium trading tools
- Tools overview
- VPS
- Genesis
- Education
- Education
- Resources
- Resources
- News & analysis
- Education hub
- Economic calendar
- Earnings announcements
- Help & support
- Help & support
- About
- About
- About GO Markets.
- Our awards
- Sponsorships
- Client support
- Client support
- Contact us
- FAQs
- Quick support
- Holiday trading hours
- Maintenance schedule
- Fraud and scam awareness
- Legal documents
- Trading
- Trading
- Markets
- Markets
- Products
- Forex
- Commodities
- Metals
- Indices
- Shares
- Cryptocurrencies
- Treasuries
- ETFs
- Accounts
- Accounts
- Compare our accounts
- Our spreads
- Funding & withdrawals
- Open account
- Try free demo
- Platforms & tools
- Platforms & tools
- Platforms
- Platforms
- Platforms overview
- TradingView
- MetaTrader 4
- MetaTrader 5
- Mobile trading platforms
- Premium trading tools
- Premium trading tools
- Tools overview
- VPS
- Genesis
- Education
- Education
- Resources
- Resources
- News & analysis
- Education hub
- Economic calendar
- Earnings announcements
- Help & support
- Help & support
- About
- About
- About GO Markets.
- Our awards
- Sponsorships
- Client support
- Client support
- Contact us
- FAQs
- Quick support
- Holiday trading hours
- Maintenance schedule
- Fraud and scam awareness
- Legal documents
- Home
- News & Analysis
- Geopolitical Events
- Brexit Impact on Global Markets
News & AnalysisThe Trading Strategies You Need to Consider to Capitalise on the Increased Volatility
The Brexit Impact on Global Markets was incredibly strong. Many believed that Brexit would never eventuate, particularly when polls and analysis led many to think that the UK would vote to stay with Europe.
However, Brexit happened and whilst it caught many off guard, it shook all asset markets in a significant way. Almost all major equity markets experienced severe drops with European markets declining more than the others in the ensuing period of the vote.
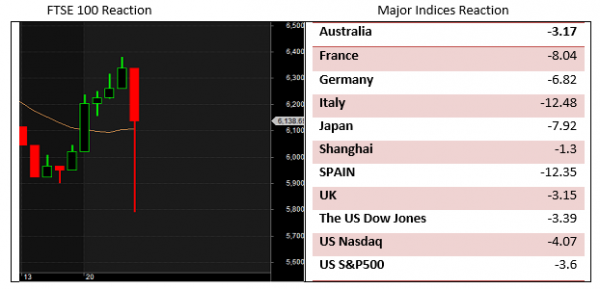
The table below shows the Brexit impact on some of the major equity markets around the globe. On average, Germany, Italy, France and Spain dropped by almost 10% compared to an average of 3.9% for US, Australia, China and Japan. This makes economic sense because these European countries are major trading partners with the UK.
Brexit is expected to lower capital and trade flow between EU and UK and is therefore more significant for EU markets rather than the non-EU ones.
The Brexit event once again highlighted the extraordinary conditions that we now face in the financial markets. It renewed heated debates about future economic growth and the fate of equity markets. I believe Brexit can have a significant impact on both long and short-term market participants.
Brexit’s short-term impact on global markets
While the lack of liquidity (as many heavyweight traders were told to stay away from the markets) and market tendency to exaggerate news can explain a large amount of volatility we just saw , it would be reasonable to believe markets will remain volatile in the near term.The reason I make such a statement is a phenomenon called Volatility Clustering (VC). According to the VC theory, once markets enter into an initial large volatility state, they will spend some time in that phase before they revert to their normal state.
Short term trading strategies and increased volatility
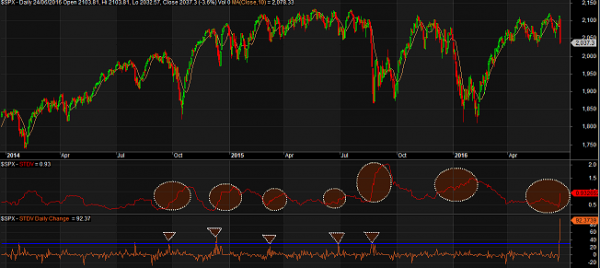
This theory has been the building block of many short-term trading strategies and is popular for options traders who can directly buy/sell volatility through various combinations of put and call contracts.The VC is clearly visible in the chart below. The upper section of this chart is the S&P500 (as a proxy for global equity markets), and the red line in the lower section is a 20-day standard deviation of daily returns.
Standard Deviation is a simple statistical tool to measure the market volatility. The white dotted circles over the red line, show the periods where market volatility was high. As you can see, once the red line turns upwards (a sign of increasing volatility) it stays in that upward position for some time before it heads downward again.
Another interesting observation comes from the orange line. This line measures the daily changes in the red line (the standard deviation line ). As can be seen, each time there was a surge in the orange line (highlighted by small triangles in the lower section of the chart), markets have faced a period of high volatility (represented by an upward slope in the red line).
During the Brexit vote, the orange line showed another notable increase, which can translate into a volatile period ahead.
Click for larger view
Using the VIX to identify periods of increased volatility
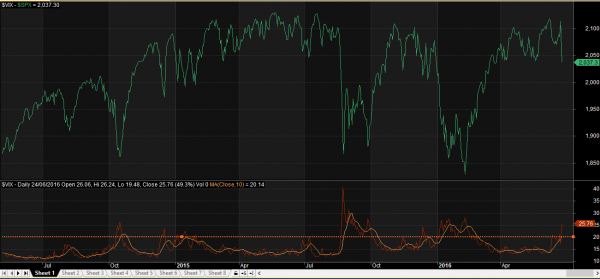
Another piece of evidence comes from VIX ( the volatility index). VIX is viewed by many as the fear index and rises when index and equity traders do not have confidence in the short term outlook for the markets. Many analysts believe that VIX with value of greater than 20 is a sign of short-term volatility and they advise caution during such times.How the S&P500 index correlates with the VIX
The green line in the chart below is the S&P500 and the red line is the VIX. As you can see, each time VIX has gone above 20, the S&P500 has seen some serious volatility over the following periods.Click for larger view
Based on the above, there is a good argument to suggest a high period of volatility, which means traders might find themselves with abundance of trading opportunities in the days ahead.
While this can be good news for short term traders, I would also like to warn that traders should be mindful of wild rapid swings (in both directions) that are associated with periods like this.
Trading strategies to consider during this increased period of Brexit volatility
It is my view that the current environment would lend itself for short time horizons with tight stops. Naturally, prudence is key. I’m also closely monitoring European indices and studying their reaction to developments in the United Kingdom.
Brexit’s long-term impact on bond yields & the S&P500 index
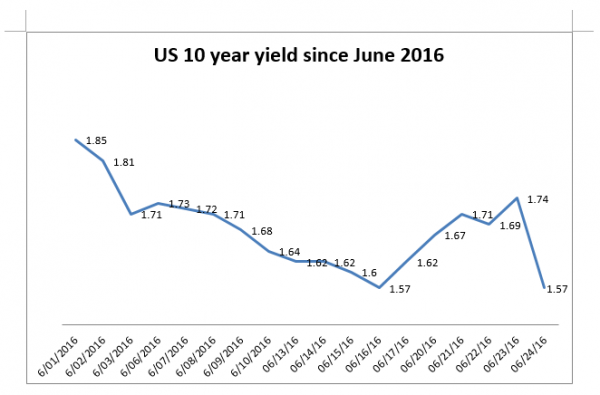
In response to Brexit, which caused an increased level of uncertainty, investors rushed to safe haven assets such as government bonds which in turn caused a severe drop in yields. Remember that bond prices and yields have an inverse relationship so that each time traders rush into bonds, yields drop.
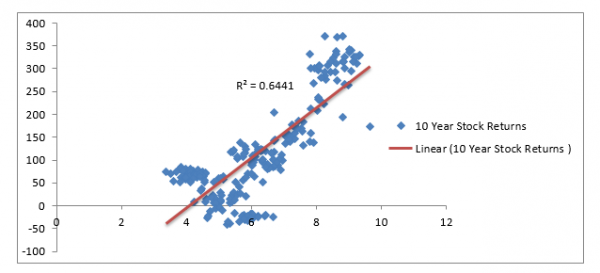
The reason I am interested in yields is the positive historical correlation between yields (in this case the yield of the ten year US government bonds) and long-term stock returns (represented by S&P500’s ten-year returns).
The horizontal axis in the scatter graph below is the US 10year yield, and the vertical axis is the corresponding subsequent ten year S&P500 returns drawn from 1987 to 2006.
Plotting the relationship between rates and stock returns
As you can clearly see, there is a positive relationship between rates and stock returns. As rates move to the right of the graph (go higher), the ten-year stock returns move higher. The R² of 65%, indicates that statistically, 65% of S&P500’s returns can be explained by the ten years US rates.Brexit and the Fed Reserve – Will they increase rates or could there be a decline?
Now that US rates are once again going down, it’d be reasonable to assume that equity markets are not going to appreciate over the long term. Thanks to Brexit, not only are analysts now discounting any possibility of another US Federal Reserve rate hike this year, but also many of them are forecasting a rate cut before the year end.Therefore, given the doomed outlook for rates and taking into account the relationship shown in the above graph, there doesn’t appear that there is anything on the horizon to inspire a burst of energy from equities and global indices.
Post-Brexit trading strategies to consider
As a result, trading strategies worth considering would be favouring short-term range bound strategies, breakouts and less of a focus on trending strategies.Where to go from the recent unexpected Brexit decision:
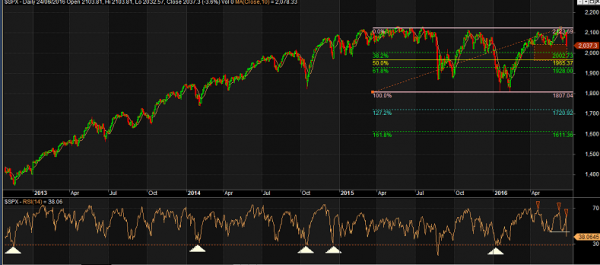
While short-term expected high volatility by itself can not necessarily forecast the future direction of the markets, one might find some clues if technicals are brought to the table.Since the rally from the February low, equity markets, in general, have had a hard time going above the 2015 highs. In the case of S&P 500, it tried to break above those levels three times and each time it left investors with disappointment.
If you look at the daily chart and compare the three most recent highs with their corresponding 14 day Relative Strength Index (RSI), you can clearly see a so-called bearish divergence between RSI and the S&P500.
During the Brexit vote, the RSI broke below its support line of 43 and confirmed this bearish divergence. Based on the historical values, RSI’s next major support level would be around 28.
If you do some maths and calculate how much further S&P500 needs to drop for RSI to reach 28, you will arrive at another 3.2 % drop.
Such a drop will put the S&P500 at the 1972 level which is 7 points above the 50% Fibonacci level drawn from February lows to recent highs. I think the next leg down would initiate if we see the S&P500 closing below 2028 in the next few days.
Click for larger view
The white triangles in the chart below show how RSI of 28 has saved the market over the past two years. Therefore, I will watch this level carefully and should it not hold (like Aug 2015), then my next target for the S&P500 would be around the February lows of 1800.
***This analysis was written right after the Brexit vote, therefore any further price movements after the initial market reactions may not be reflected in this analysis.
Please note that trading Forex and Derivatives carries a high level of risk, including the risk of losing substantially more than your initial investment. Also, you do not own or have any rights to the underlying assets. You should only trade if you can afford to carry these risks. Our offer is not designed to alter or modify any individual’s risk preference or encourage individuals to trade in a manner inconsistent with their own trading strategies.

Ramin Rouzabadi (CFA, CMT) | Trading Analyst Ramin is a broadly skilled investment analyst with over 13 years of domestic and international market experience in equities and derivatives.
With his financial analysis (CFA) and market technician (CMT) background, Ramin is adept at identifying market opportunities and is experienced in developing statistically sound investment strategies.
Connect with Ramin: Twitter | LinkedIn | Ramin’s posts
Ready to start trading?
Disclaimer: Articles are from GO Markets analysts and contributors and are based on their independent analysis or personal experiences. Views, opinions or trading styles expressed are their own, and should not be taken as either representative of or shared by GO Markets. Advice, if any, is of a ‘general’ nature and not based on your personal objectives, financial situation or needs. Consider how appropriate the advice, if any, is to your objectives, financial situation and needs, before acting on the advice.
Next Article
Benefits of a MT4 Demo Trading Account
Top 5 Benefits of a MT4 Demo Trading Account A MT4 Demo trading account is a virtual trading account that allows you to make virtual trades with play money. Demo trading accounts replicate Live trading accounts, but it removes the risk of losing your own trading capital until you are comfortable trading with real money. Most Forex brokers now o...
June 28, 2016Read More >Previous Article
The Aftermath of Brexit – Point & Figure Analysis
Aftermath of Brexit Today we'll take a look at the aftermath of the Brexit vote using point and figure analysis. As we begin to process the magnitude ...
June 28, 2016Read More >Please share your location to continue.
Check our help guide for more info.


