- Trading
- Trading
- Markets
- Markets
- Products
- Forex
- Commodities
- Metals
- Indices
- Shares
- Cryptocurrencies
- Treasuries
- ETFs
- Accounts
- Accounts
- Compare our accounts
- Our spreads
- Funding & withdrawals
- Open account
- Try free demo
- Platforms & tools
- Platforms & tools
- Platforms
- Platforms
- Platforms overview
- TradingView
- MetaTrader 4
- MetaTrader 5
- Mobile trading platforms
- Premium trading tools
- Premium trading tools
- Tools overview
- VPS
- Genesis
- Education
- Education
- Resources
- Resources
- News & analysis
- Education hub
- Economic calendar
- Earnings announcements
- Help & support
- Help & support
- About
- About
- About GO Markets.
- Our awards
- Sponsorships
- Client support
- Client support
- Contact us
- FAQs
- Quick support
- Holiday trading hours
- Maintenance schedule
- Fraud and scam awareness
- Legal documents
- Trading
- Trading
- Markets
- Markets
- Products
- Forex
- Commodities
- Metals
- Indices
- Shares
- Cryptocurrencies
- Treasuries
- ETFs
- Accounts
- Accounts
- Compare our accounts
- Our spreads
- Funding & withdrawals
- Open account
- Try free demo
- Platforms & tools
- Platforms & tools
- Platforms
- Platforms
- Platforms overview
- TradingView
- MetaTrader 4
- MetaTrader 5
- Mobile trading platforms
- Premium trading tools
- Premium trading tools
- Tools overview
- VPS
- Genesis
- Education
- Education
- Resources
- Resources
- News & analysis
- Education hub
- Economic calendar
- Earnings announcements
- Help & support
- Help & support
- About
- About
- About GO Markets.
- Our awards
- Sponsorships
- Client support
- Client support
- Contact us
- FAQs
- Quick support
- Holiday trading hours
- Maintenance schedule
- Fraud and scam awareness
- Legal documents
- Home
- News & Analysis
- Oil, Metals, Soft Commodities
- Natural Gas – technical analysis
News & AnalysisThe United States used 30.28 trillion cubic feet of natural gas in 2021, making them the world’s largest consumer of natural gas. Natural gas consumption in the United States has two seasonal peaks, largely reflecting weather-related fluctuations in energy demand. One of the biggest consumptions of gas is industrial, residential and commercial cooling and heating systems (eia, 2022).
As the world’s largest user of natural gas transitions out of summer, will this change indicate a decrease of their natural gas consumption?
Could the decrease in demand for cooling be reflected on the technical charts?
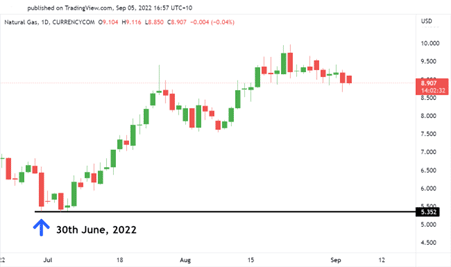
On a daily timeframe, natural gas has been on a steady upward trend since the end of June, in tandem with the beginning of summer in the US (seen on the chart below).

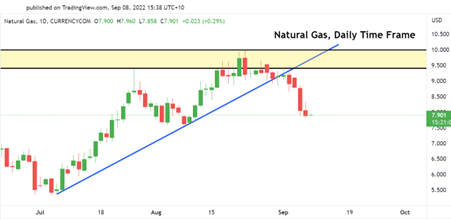
A trendline from the beginning of that trend until now can be drawn, and we can see recently that line has been broken by a daily candlestick, closing below the trendline which can indicate a change in trend for natural gas.

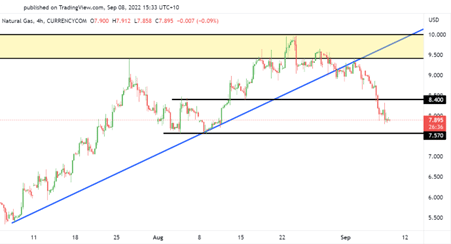
After the strong break below of the trendline followed by multiple bearish daily candlesticks, we can consequently expect further downside movement for natural gas, after breaking through a strong support at $8.4, in all probability with natural gas currently sitting at $7.895 we could see natural gas come down to the next support level around $7.57.

Ready to start trading?
Disclaimer: Articles are from GO Markets analysts and contributors and are based on their independent analysis or personal experiences. Views, opinions or trading styles expressed are their own, and should not be taken as either representative of or shared by GO Markets. Advice, if any, is of a ‘general’ nature and not based on your personal objectives, financial situation or needs. Consider how appropriate the advice, if any, is to your objectives, financial situation and needs, before acting on the advice.
Next Article
Kroger tops estimates for Q2 – the stock is up
The Kroger Company (KR) released its latest financial results for Q2 on Friday. The American grocery supermarket chain reported revenue of $34.638 billion for the quarter vs. $34.461 billion estimate. Earnings per share also beat analyst estimates at $0.90 per share vs. $0.82 per share expected. "Kroger delivered strong second quarter resu...
September 12, 2022Read More >Previous Article
NIO Q2 results have arrived
NIO Q2 results have arrived NIO Inc. (NIO) reported its unaudited second quarter financial results on Wednesday. The Chinese electric vehicle ma...
September 8, 2022Read More >Please share your location to continue.
Check our help guide for more info.


