- Trading
- Trading
- Markets
- Markets
- Products
- Forex
- Commodities
- Metals
- Indices
- Shares
- Cryptocurrencies
- Treasuries
- ETFs
- Accounts
- Accounts
- Compare our accounts
- Our spreads
- Funding & withdrawals
- Open account
- Try free demo
- Platforms & tools
- Platforms & tools
- Platforms
- Platforms
- Platforms overview
- TradingView
- MetaTrader 4
- MetaTrader 5
- Mobile trading platforms
- Premium trading tools
- Premium trading tools
- Tools overview
- VPS
- Genesis
- Education
- Education
- Resources
- Resources
- News & analysis
- Education hub
- Economic calendar
- Earnings announcements
- Help & support
- Help & support
- About
- About
- About GO Markets.
- Our awards
- Sponsorships
- Client support
- Client support
- Contact us
- FAQs
- Quick support
- Holiday trading hours
- Maintenance schedule
- Fraud and scam awareness
- Legal documents
- Trading
- Trading
- Markets
- Markets
- Products
- Forex
- Commodities
- Metals
- Indices
- Shares
- Cryptocurrencies
- Treasuries
- ETFs
- Accounts
- Accounts
- Compare our accounts
- Our spreads
- Funding & withdrawals
- Open account
- Try free demo
- Platforms & tools
- Platforms & tools
- Platforms
- Platforms
- Platforms overview
- TradingView
- MetaTrader 4
- MetaTrader 5
- Mobile trading platforms
- Premium trading tools
- Premium trading tools
- Tools overview
- VPS
- Genesis
- Education
- Education
- Resources
- Resources
- News & analysis
- Education hub
- Economic calendar
- Earnings announcements
- Help & support
- Help & support
- About
- About
- About GO Markets.
- Our awards
- Sponsorships
- Client support
- Client support
- Contact us
- FAQs
- Quick support
- Holiday trading hours
- Maintenance schedule
- Fraud and scam awareness
- Legal documents
- Home
- News & Analysis
- Shares and Indices
- NIO Q2 results have arrived
- 1 month -14.66%
- 3 months -16.05%
- Year-to-date -45.99%
- 1 year -55.14%
- B of A Securities $26
- UBS $32
- Mizuho $60
- Morgan Stanley $34
- Barclays $34
- Deutsche Bank $70
- Goldman Sachs $56
News & AnalysisNIO Q2 results have arrived
NIO Inc. (NIO) reported its unaudited second quarter financial results on Wednesday.
The Chinese electric vehicle maker reported revenue of $1.538 billion for the quarter, beating analyst estimate of $1.458 billion.
Loss per share reported at -$0.20 per share vs. -$0.16 loss per share expected.
William Bin Li, founder, chairman and CEO of the EV company commented on NIO’s performance in Q2: ”We delivered 25,059 vehicles in the second quarter of 2022, representing a growth of 14.4% year-over-year despite the COVID-19 related challenges. With the teams’ concerted efforts, our deliveries started to recover and achieved 10,052 and 10,677 units in July and August, respectively.”
“The second half of 2022 is a critical period for NIO to scale up the production and delivery of multiple new products. The ES7, our first mid-large five-seater smart electric SUV based on NIO Technology 2.0 (NT2.0), has become a new favorite of the market with its superior performance, comfort and digital experience. We witnessed a robust order inflow for the ES7 and started its deliveries at scale in August. We also look forward to starting the mass production and delivery of the ET5 in late September. With the compelling product portfolio and well-established brand awareness, NIO will attract a broader user base and embrace robust growth in the coming quarters,” Li concluded.
NIO has delivered a total of 238,626 vehicles as of August 31, 2022.
The company expects deliveries of between 31,000 to 33,000 in Q3 and revenue of between $1.913 billion and $2.030 billion.
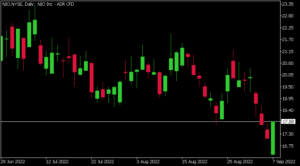
NIO Inc. (NIO) chart

The stock was up by around 3% at the market open in the US on Wednesday, trading at $17.88 a share.
Here is how the stock has performed in the past year:
NIO price targets
NIO Inc. is the 15th largest automaker in the world with a market cap of $28.62 billion.
You can trade NIO Inc. (NIO) and many other stocks from the NYSE, NASDAQ, HKEX and the ASX with GO Markets as a Share CFD.
Sources: NIO Inc., TradingView, MarketWatch, Benzinga, CompaniesMarketCap
Ready to start trading?
Disclaimer: Articles are from GO Markets analysts and contributors and are based on their independent analysis or personal experiences. Views, opinions or trading styles expressed are their own, and should not be taken as either representative of or shared by GO Markets. Advice, if any, is of a ‘general’ nature and not based on your personal objectives, financial situation or needs. Consider how appropriate the advice, if any, is to your objectives, financial situation and needs, before acting on the advice.
Next Article
Natural Gas – technical analysis
The United States used 30.28 trillion cubic feet of natural gas in 2021, making them the world’s largest consumer of natural gas. Natural gas consumption in the United States has two seasonal peaks, largely reflecting weather-related fluctuations in energy demand. One of the biggest consumptions of gas is industrial, residential and commercial co...
September 8, 2022Read More >Previous Article
Oil Price tumbles to 7 month lows as recession fears grow
Brent Crude and West Texas Intermediate Oil both fell to their lowest levels since January as fresh recession fears swept the market. Brent dropped to...
September 8, 2022Read More >Please share your location to continue.
Check our help guide for more info.


